Figure 1: Key Economic Data points in February
Sources: Yahoo Finance, Briefing.com, Tradingeconomics.com.
×

Figure 2: S&P 500 Index
This shows the rising channel in the S&P 500 index that goes back to the end of 2011/early 2012. Each bar represents one month.
×
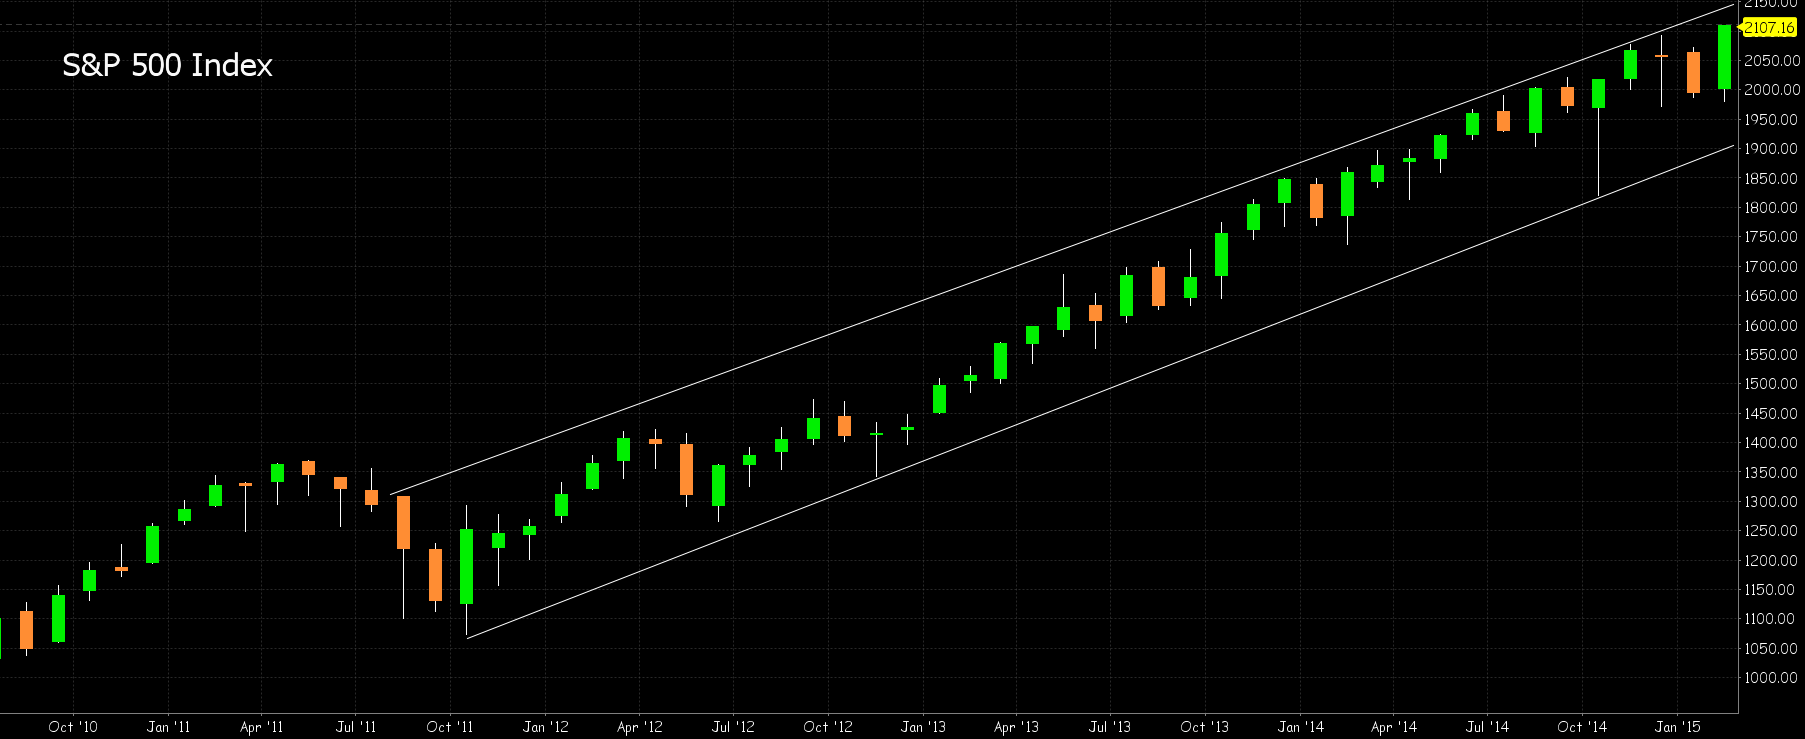
Figure 3: Average Hourly Earnings (Percentage change YoY)
This shows the percentage change year-on-year. Note that wage growth is positive. Also note that wage growth lags the actual recession shown in the shaded area.
×

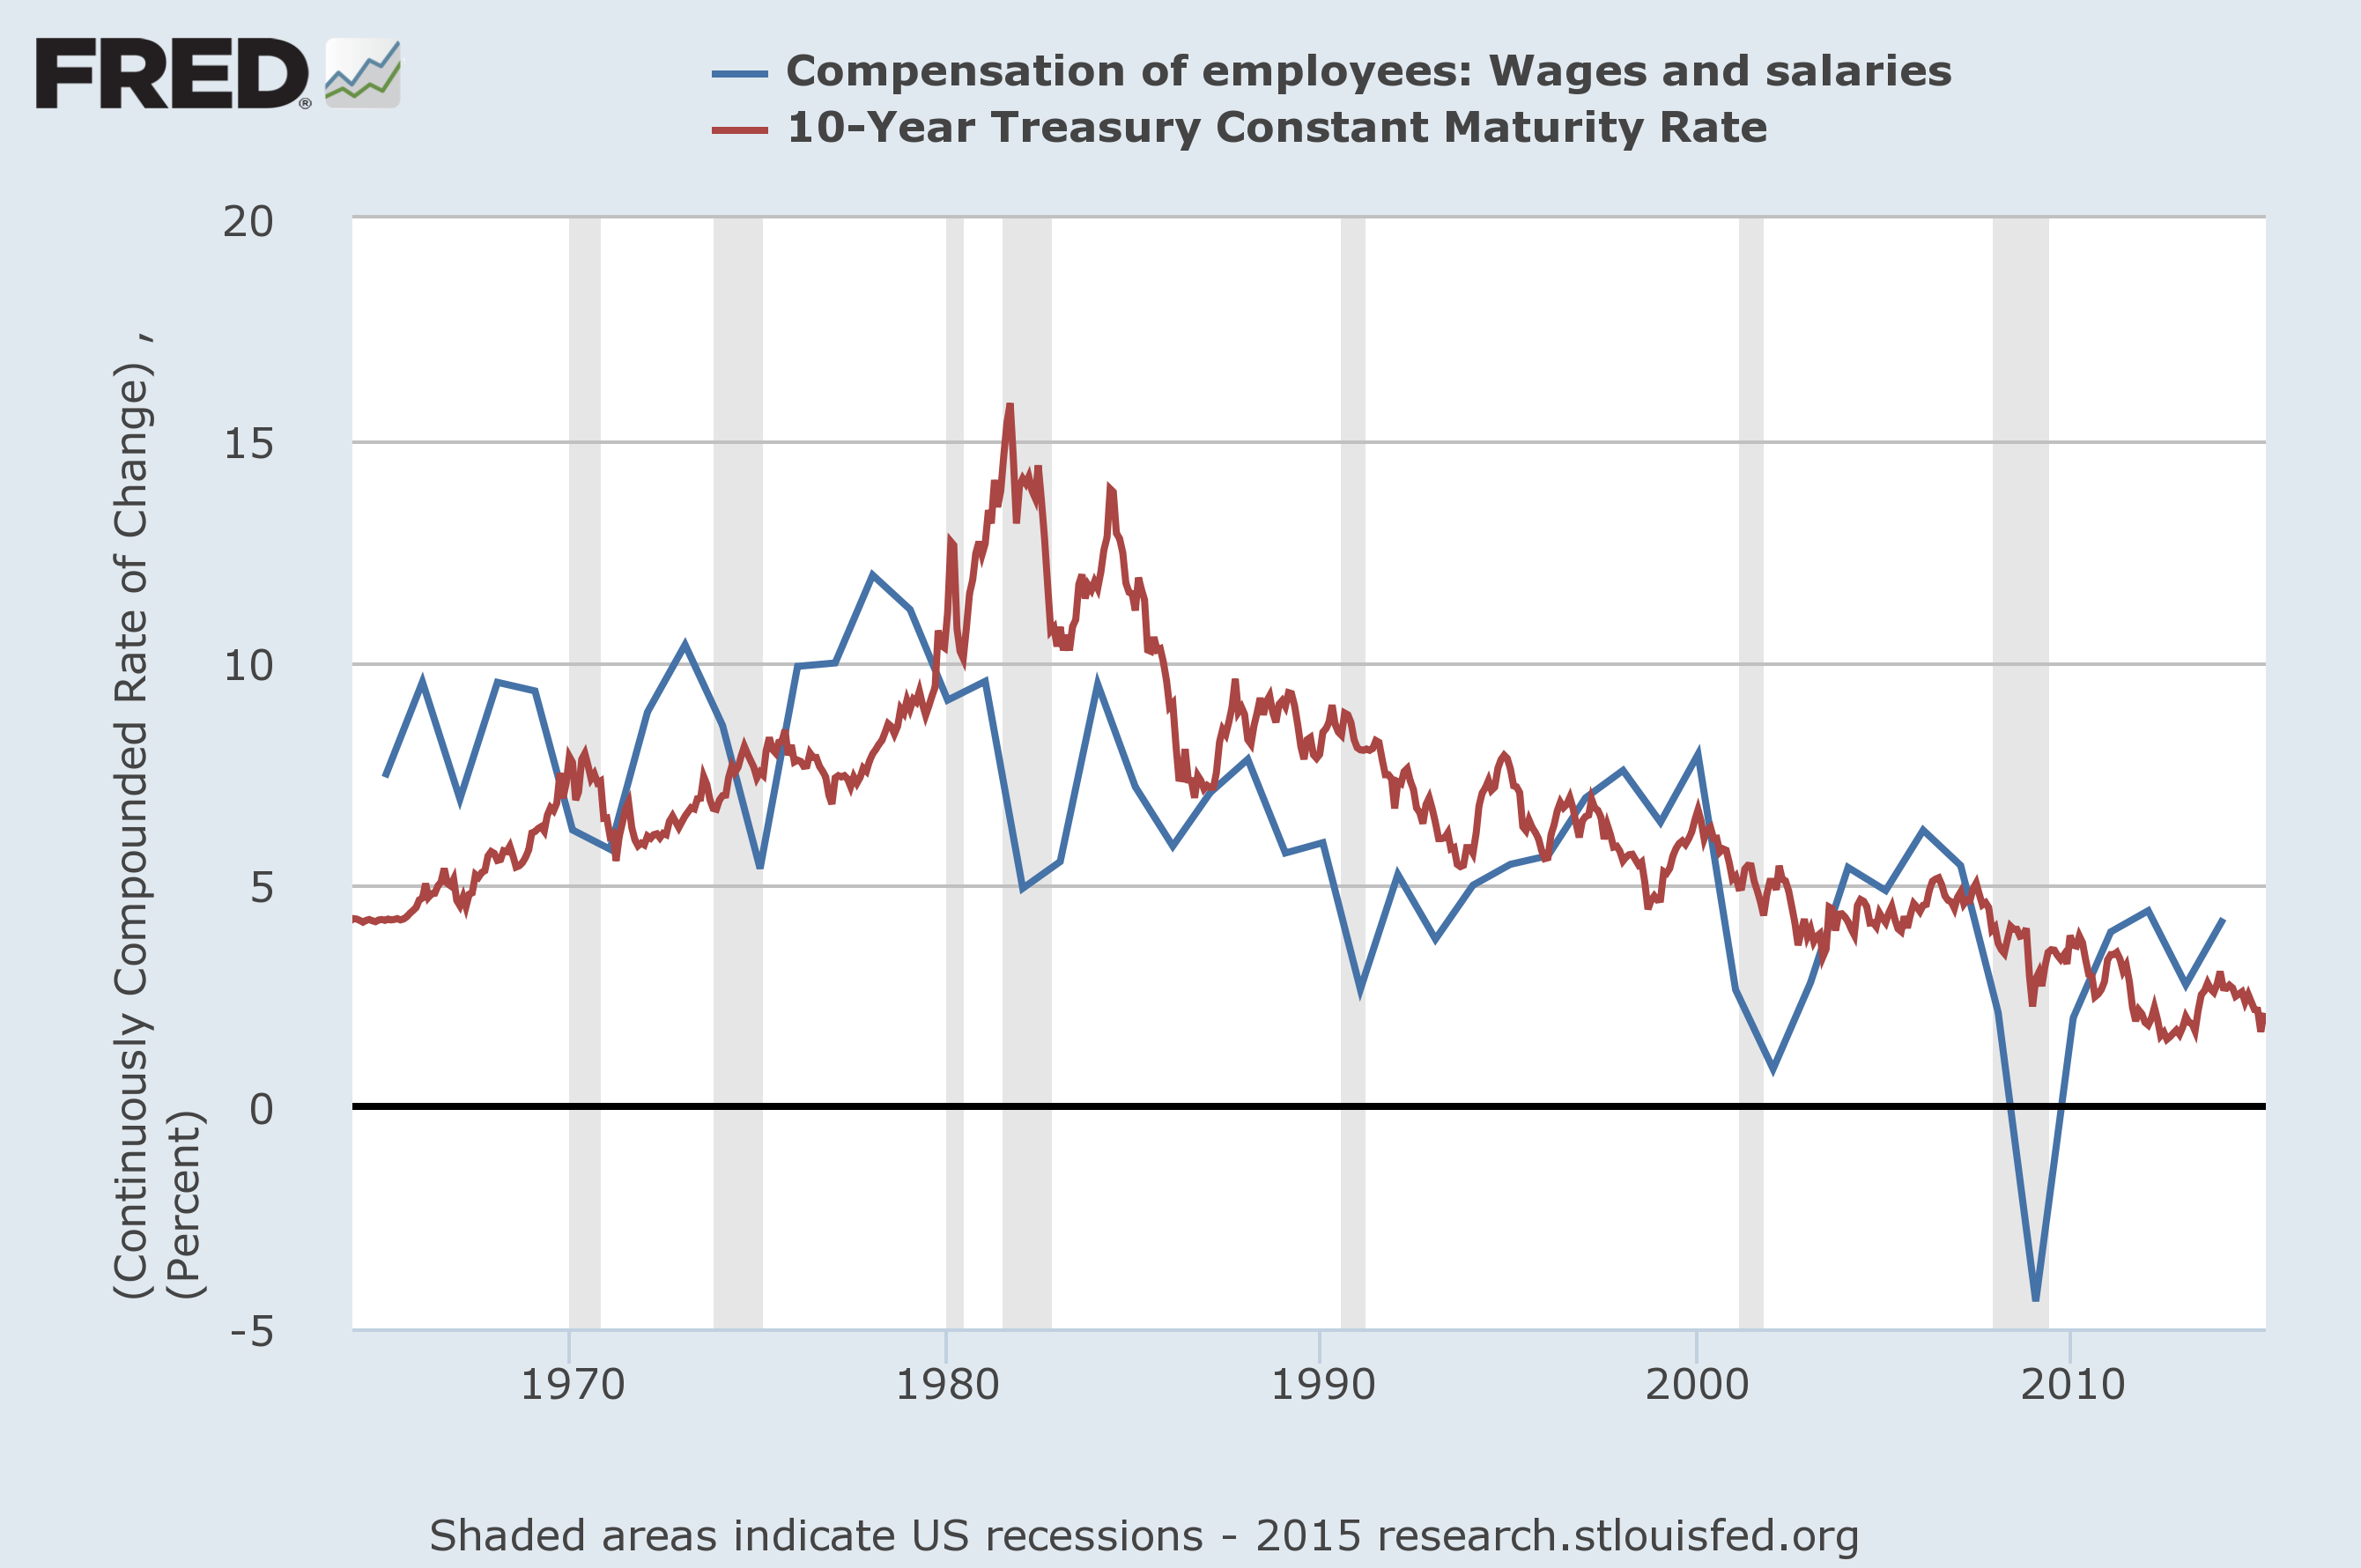
Figure 4: Wages and the 10 year
This chart shows the contiuously compounded rate of change of employee compensation relative to the yield on the 10-year treasury. Note how yields have followed wages lower.
×
Waiting Wages
Monday 02/23/15
Last week many of the major indices rose to new all-time highs. Despite the cheeriness of stocks, economic data, which had been fairly good, has stumbled a bit in February. In fact, there has been a pretty awful string of below consensus misses in the data that has come in February. Figure 1 shows the number of misses vs. beats in the data that has come in so far. Figure 2 shows that the S&P 500 is comfortably continuing its trek higher within the same rising channel that goes back to the end of 2012. If you were under the impression that economic data drives stock prices in the short term you may want to note the giant green bar for February and reconsider.Despite the overwhelming number of economic misses, the data surrounding employment and wages has been very good. 2014 was the best year for job growth in the United States since 1999 with the unemployment rate falling from 6.7% to 5.6% (Unemployment ticked back up to 5.7% in January). Although the unemployment rate fell at such a rapid pace in 2014, employees did not see much of a boost in salaries. This of course is actually very normal, because wages are a lagging economic indicator, meaning that wage increases are apparent after the after the economy has already shifted.
It is still too early to declare a win for wages, but the January employment report showed a 2.2% increase in average hourly earnings. As you can see from figure 3, the data can be very noisy on a month-to-month basis, but there are early signs of encouragement. Last week Walmart announced that it would be raising wages for about half a million workers. It was not only Walmart who was raising wages though. Gap gave a raise to about 65,000 workers, Ikea announced wage increases for about 11,000 employees, and Insurer Aetna raised wages for about 5,700 workers. These increases will take place gradually over the next couple years. This is great news if you work at one of these companies, and it is also great news for fed officials who have been struggling to get more inflation.
While quantitative easing may have increased the fed’s balance sheet it didn’t have much impact on inflation. There were fears that it would lead to uncontrollable runaway inflation, but those fears never materialized in the data. Money can be created, but if it never enters the economy it isn’t going to have a huge impact on inflation. Let’s say Apple made a billion iphones, then took 999 million phones and buried them in the desert. The value for those phones would be based on the 1 million phones that are actually for sale, not the billion total phones. The same idea applies to money, the money that the fed created doesn’t really exist if the banks don’t lend it out or otherwise use it in the real economy. Banks have been making loans to large businesses for share buybacks and investing in market activities, but they haven’t done a great job of extending loans to consumers or small businesses. This means that inflation should only be showing up in assets like stocks and bonds and not in commodities and consumer goods.
Looking back at figure 3, you can see that during the last recession (the shaded area) wages didn’t really react until late in the recession where they started falling and continued to fall long after the recession had officially ended. This works the other way too, wages will lag behind a booming economy. A prolonged period of rising wages would generally be a bad thing for bonds. Wages are seen as a proxy for inflation. Figure 4 shows how changes in wages are linked to the yield on a 10-year treasury. Certainly not in the short term, but in the very long term as wages move lower so do 10 year treasury yields. The compounded rate of change of wages peaked in the late 70s and bond yields peaked shortly thereafter. Since then, the rate of change in wages has declined alongside bond yields. If wages are truly starting to turn a corner and begin rising it would likely be wise to begin reducing exposure to fixed rate bonds.
I have been a bond bull for quite some time, yet I am beginning to take a more neutral stance. Bonds have 30+ years of momentum as a tailwind so it would be unwise to try and time the exact top, however I am beginning to see some value in TIPS and other unloved inflation linked assets.
| Index | Closing Price | Last Week | YTD |
|---|---|---|---|
| SPY (S&P 500 ETF) | 211.239 | 0.88% | 2.76% |
| IWM (Russell 2000 ETF) | 122.38 | 0.59% | 2.41% |
| QQQ (Nasdaq 100 ETF) | 108.41 | 1.4% | 5.1% |
Figure 1: Key Economic Data points in February
Figure 2: S&P 500 Index
Figure 3: Average Hourly Earnings (Percentage change YoY)
Figure 4: Wages and the 10 year