Figure 1: Labor Force Participation Rate
Source: Bureau of Labor Statistics
×

Figure 2: Average Hourly Earnings (Percentage change YoY)
Source: Bureau of Labor Statistics
×

Figure 3: S&P 500
×
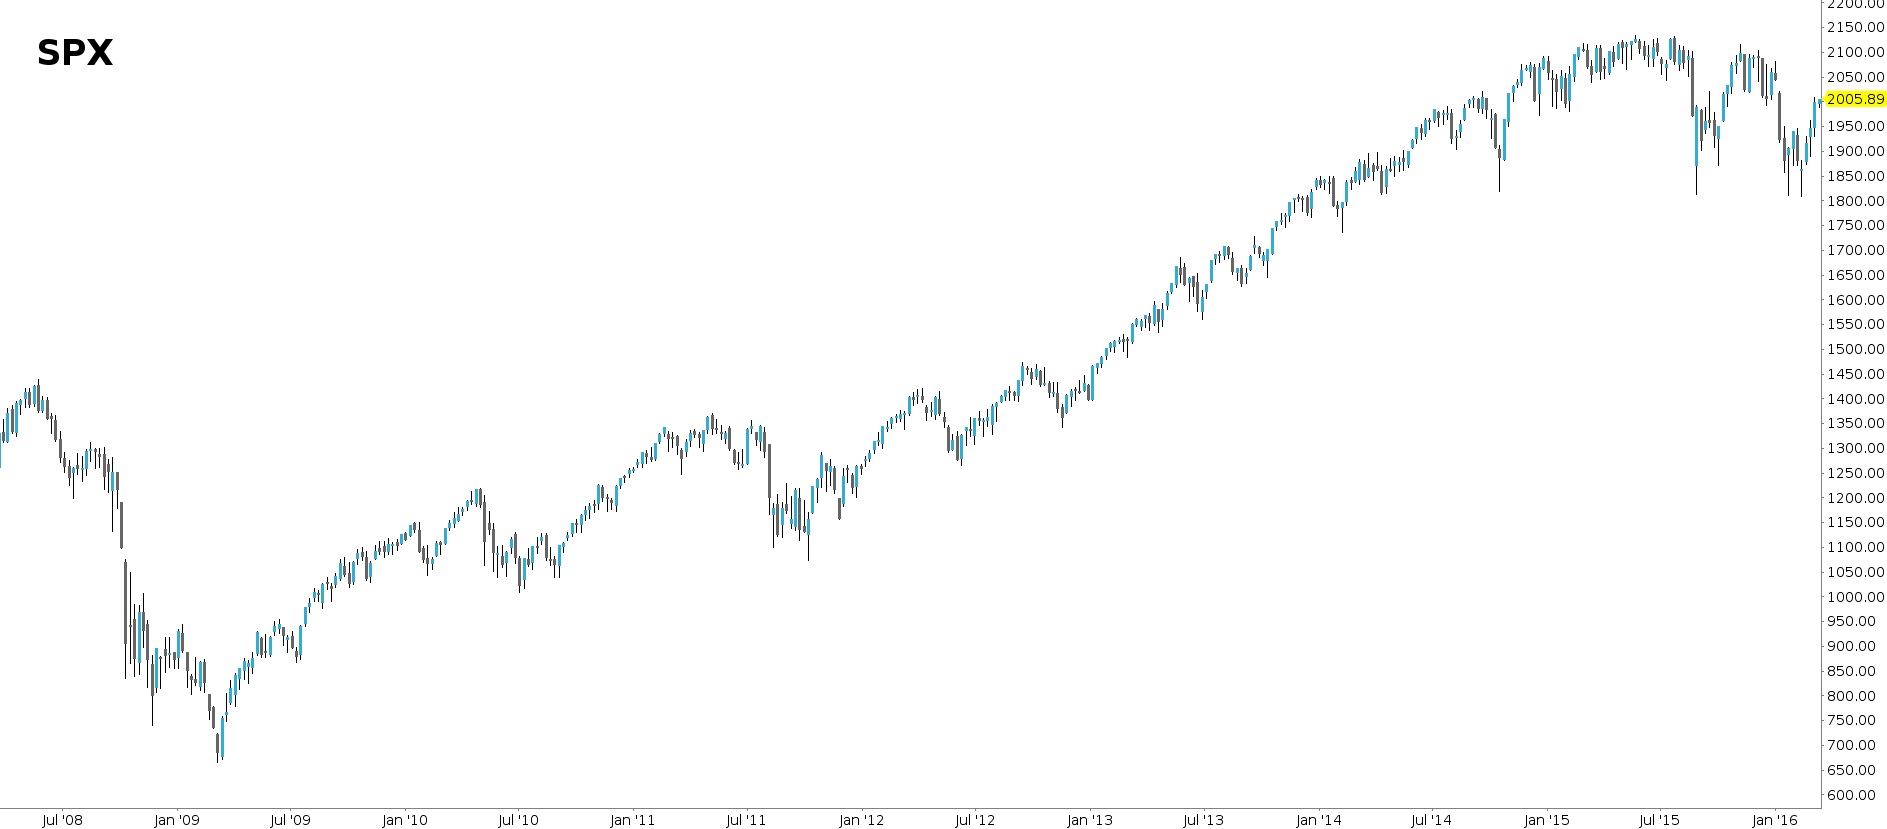
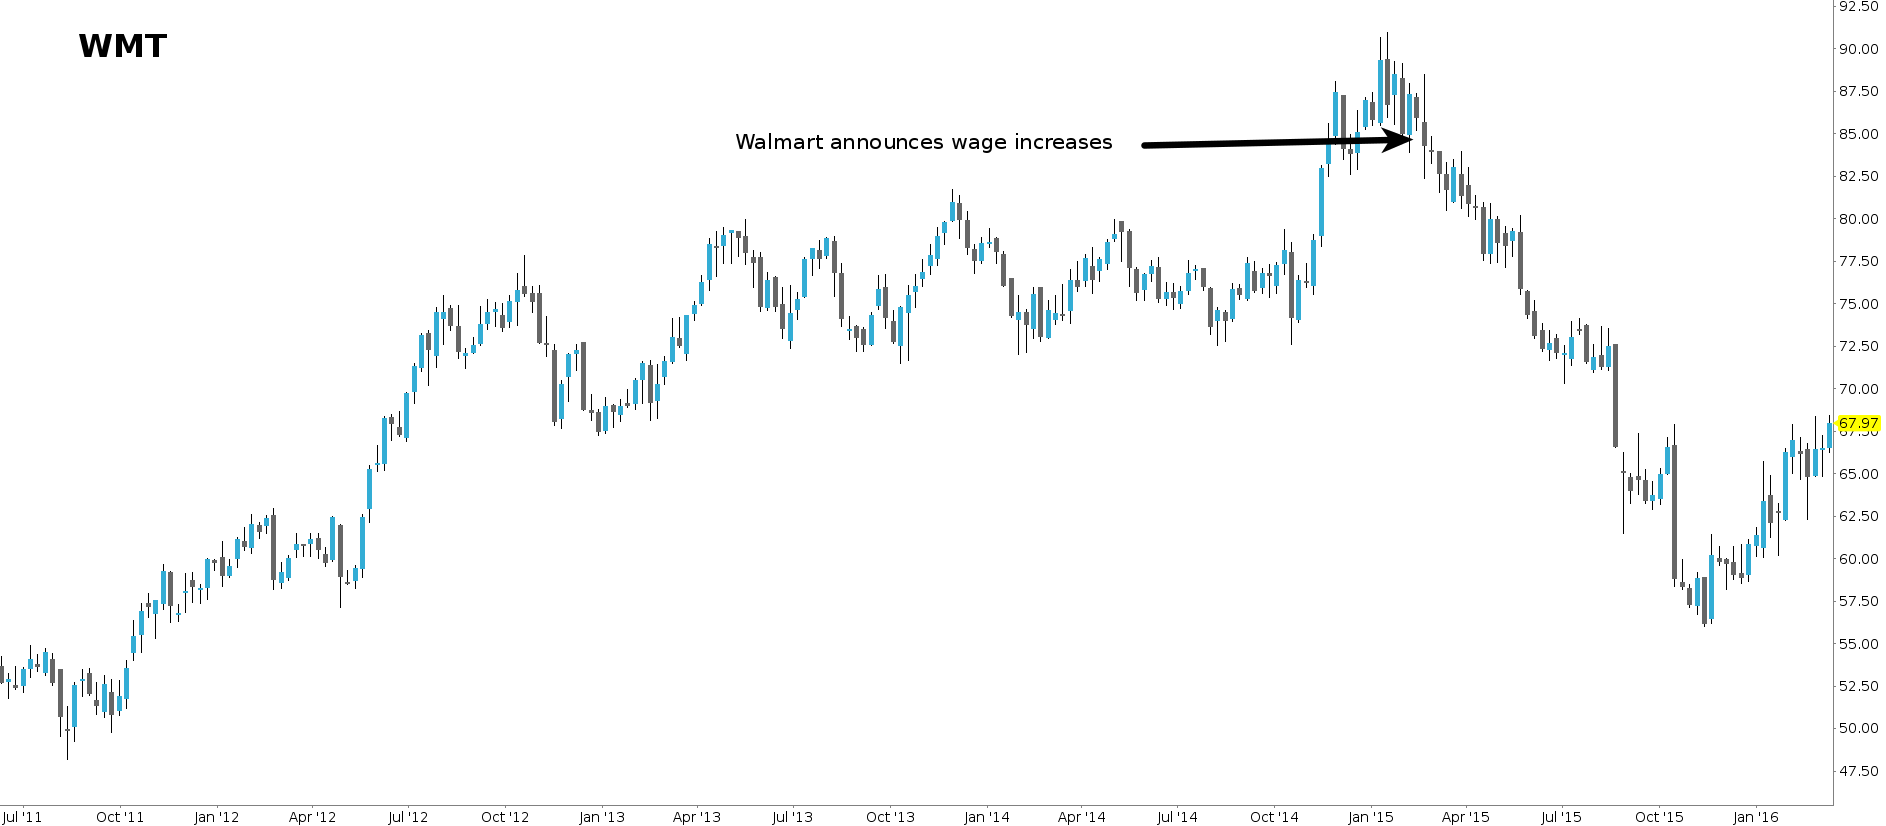
Figure 4: Walmart Stock Price
×
Recovery for Everyone Else
Monday 03/07/16
The headline unemployment number has been trending down since the spike that followed the housing crisis in 2008/2009, but for most Americans this recovery has seemed different than the others. Some of the possible reasons why it feels different are: wages have been stagnant, much of the decline in the rate can be attributed to discouraged workers dropping out of the labor force and income inequality has increased. This week we will look at the most recent report and examine some of the developments surrounding employment.The February employment report was released last Friday showing a growth of 242,000 jobs, much higher than expectations for an addition of about 180,000. What was even more encouraging was that it is starting to look like people are coming back into the labor force as the participation rate increased to 62.9%. Figure 1 shows the labor force participation rate going back to 1948. The chart shows an increase in the 70's and 80's as more women began entering the workforce. However, since the tech bubble burst in 2000 the rate has been declining, the decline accelerated after the housing bubble burst in 2008. This is clearly a long term structural problem, but the last few months have shown a sudden reversal in this trend. As you can see, the bounce is pretty small if you take the long view, but is encouraging nonetheless.
The number of people who were marginally attached to the labor force fell by 365,000 from the same month last year. The marginally attached are those who wanted to work, had looked for a job in the last year, but were not included in the unemployment rate because they had not searched for work in the last 4 weeks prior to the survey. This is very encouraging news and a trend that will hopefully continue.
The less good news was that the growth in average hourly earnings slowed over last month, but still increased from last year. Figure 2 shows the percentage change of average hourly wages from the same month last year. Most economists were expecting a continuation of the trend of higher growth that we have seen over the last year or so. Earnings in January likely got a boost from minimum wage hikes that were set to go into effect at the beginning of 2016, so I don't think it's that surprising that growth slowed in February.
When people point to charts showing rising income inequality they often, without realizing it, are actually making an observation on stock prices. As stock prices rise, income inequality will almost certainly also rise. Since the recession, stocks have rebounded significantly but since mid 2014, stocks have moved sideways (see figure 3). This is a really good situation for reducing income inequality. If wages continue to rise, inflation remains subdued and stocks continue to move sideways, income inequality will fall. Corporate earnings declined in the last quarter of 2015 and most likely the first quarter of 2016 which can mostly be attributed to a strong dollar (foreign sales from US corporations are reported in dollars, so when the dollar is strong those sales will decline unless they raise prices). However, wage increases are also having an impact. Walmart's CFO has warned that earnings will decline in fiscal 2017 (February 2016-January 2017) because they will spend $1.5 billion on wage increases and job training. Walmart was the first to lead this charge, but their move has forced many other retail outlets like The Gap to increase their wages. Walmart's stock price has suffered as a result of these hikes as you can see in figure 4. This is a significant redistribution of income and the trend is positive for low-skilled and low-income workers.
There is certainly still a long way to go, but there are signs that the real economy is regaining its strength. Cheap energy, rising wages and more people coming back to work are very positive for the real economy. This wealth transfer may not necessarily be good for stocks in the short term, but will create a stronger more sustainable base in the longer term. Ideally stocks will continue to correct sideways without a panic and wages will rise. This would allow the fed to continue bringing interest rates back to normalcy and perhaps less people will feel like this recovery has forgotten them.
| Index | Closing Price | Last Week | YTD |
|---|---|---|---|
| SPY (S&P 500 ETF) | 200.43 | 2.73% | -1.61% |
| IWM (Russell 2000 ETF) | 107.72 | 4.45% | -3.31% |
| QQQ (Nasdaq 100 ETF) | 105.67 | 2.28% | -6.11% |
Figure 1: Labor Force Participation Rate
Figure 2: Average Hourly Earnings (Percentage change YoY)
Figure 3: S&P 500
Figure 4: Walmart Stock Price