Figure 1: Houses sold with FHA financing (Thousands per quarter)
Source: U.S. Bureau of the Census
×
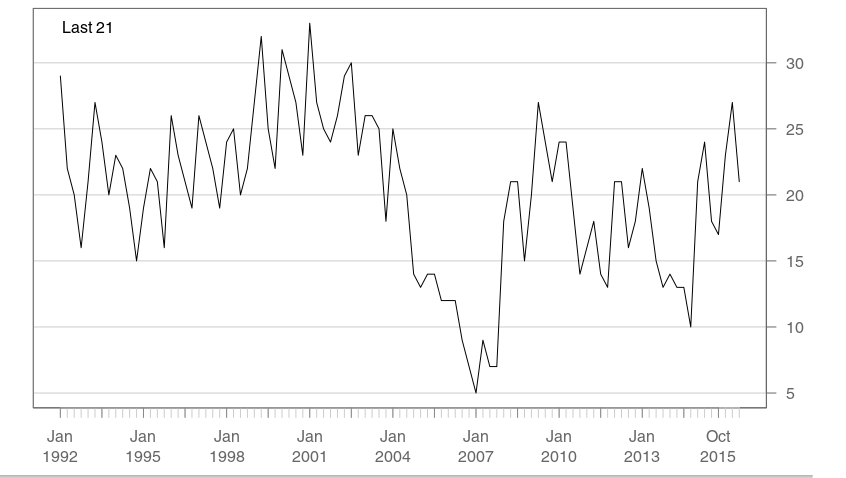
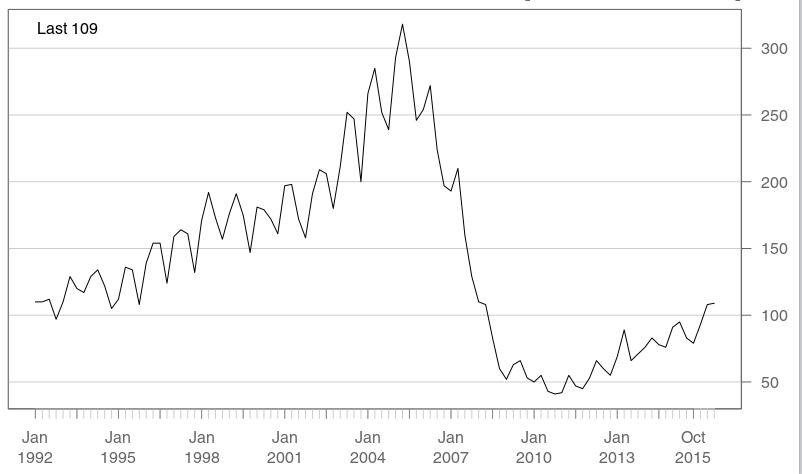
Figure 2: Houses sold with Conventional Mortgage (Thousands per quarter)
Source: U.S. Bureau of the Census
×
FHA
Monday 01/23/17
You may have heard that Trump was sworn in as president last Friday, but you may not have noticed his first order of business. Within the first hour after he became president Trump reversed a last minute decision by the Obama administration to lower the annual mortgage insurance premium for FHA loans by 0.25%. This week we will look at what FHA loans are and what this means.Lots of Acronyms
FHA stands for Federal Housing Administration which was created by the 1934 Housing Act and later became part of Housing and Urban Development or HUD. The FHA makes loans primarily to first time home buyers. FHA loans only require a down payment of 3.5% of the purchase price. Since the down payment is much lower than a conventional mortgage, FHA mortgages include additional costs to offset higher default rates. FHA charges an upfront mortgage insurance premium (UFMIP) that is either paid during loan closing or it can be financed into the mortgage itself. Additionally, borrowers must also pay annual mortgage insurance premiums (MIP), these payments are added to the monthly bill paid by FHA borrowers, but do not go towards the loan. MIP and UFMIP both go to the mutual mortgage insurance fund or MMIF; this fund is used to cover the cost of defaulting borrowers. Generally when news articles mention FHA insurance premiums they are referring to MIP. Rates for both MIP and UFMIP have been fluctuating quite a bit since the housing crisis in 2008.
Recent changes to FHA
Unless you work in the industry, you are probably unaware of the recent changes in FHA premiums and their impact on the market. Figure 1 shows the number of quarterly FHA mortgages over the last 25 years. You can see that beginning around 2004 FHA use began declining as more borrowers were able to qualify for conventional loans thanks to reduced lending standards, falling interest rates and rising home values. For comparison, figure 2 shows conventional mortgages originated.
For many years FHA did not change its rates which were 0.5% MIP and 1.5% UFMIP. Beginning in 2008 it became apparent that FHA was going to encounter difficulties. In order to reduce budget shortfalls it began tinkering with the rates it charged. It first changed to a complicated set of rates that ranged from 0.5% to 0.55% MIP and 1.25% to 2.25% UFMIP based on a combination of credit score, loan-to-value and length of mortgage. This was dropped after a few months and was replaced with the current pricing structure based on loan-to-value and length of mortgage (15 or 30 years). UFMIP was set at 1.75% and MIP ranged from nothing to 0.55%. In 2010, as the budget shortfall worsened FHA raised UFMIP to 2.25% in an attempt to balance their budget, but this led to a backlash from realtors and others in the industry who felt that this was stifling purchases. This in turn led to numerous changes to pricing that has continued until the present which included reducing MIP and raising UFMIP in a variety of configurations.
In 2013, FHA required an infusion from the treasury of $1.7 billion to meet its budget shortfall. Since then things have improved somewhat at FHA and now some feel it is time to start reducing mortgage premiums again. The last change in January of 2015 set UFMIP at 1.75% and cut MIP on non-jumbo 30 year loans to 0.8%. Obama’s most recent cut last week would have lowered MIP to 0.60% while keeping UFMIP the same. Now that Trump canceled that increase everything will remain the same as it was since January of 2015.
FHA has budget authority which means that its 2013 bailout wasn’t really a bailout, it was just a transfer from the treasury (taxpayers) to FHA. In the event of another housing crisis, FHA would require further bailouts. I am personally not a big fan of FHA, but if it is going to exist it should probably be managed independently by a team whose goal is to minimize taxpayer losses. Managing FHA based on short term political whims or in a panic scenario like we did post-2008 is not a prudent strategy.
| Index | Closing Price | Last Week | YTD |
|---|---|---|---|
| SPY (S&P 500 ETF) | 226.74 | 0.19% | 1.17% |
| IWM (Russell 2000 ETF) | 134.44 | -0.86% | -0.72% |
| QQQ (Nasdaq 100 ETF) | 123.25 | 0.37% | 4.11% |
Figure 1: Houses sold with FHA financing (Thousands per quarter)
Figure 2: Houses sold with Conventional Mortgage (Thousands per quarter)