Figure 1: Earnings Yield
This chart shows the earnings yield of the S&P 500. Source: S&P, Bloomberg, Aswath Damodaran
×
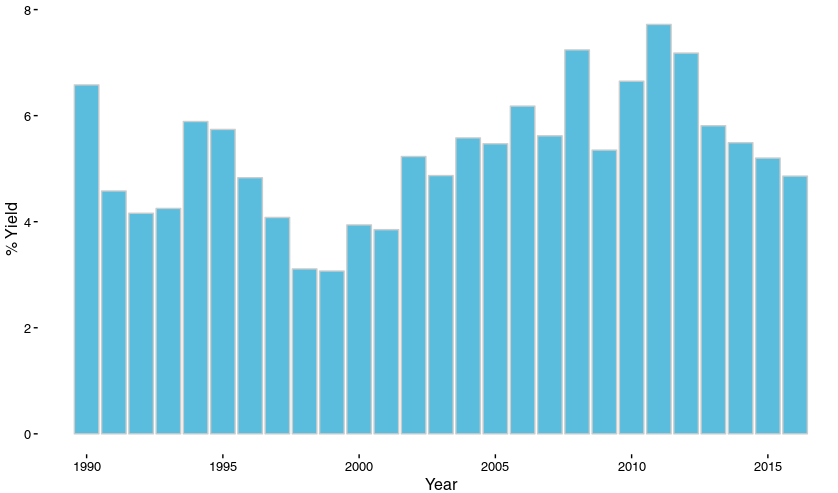
Figure 2: Earnings Per Share of the S&P 500
Source: S&P 500, Bloomberg, Aswath Damodaran
×
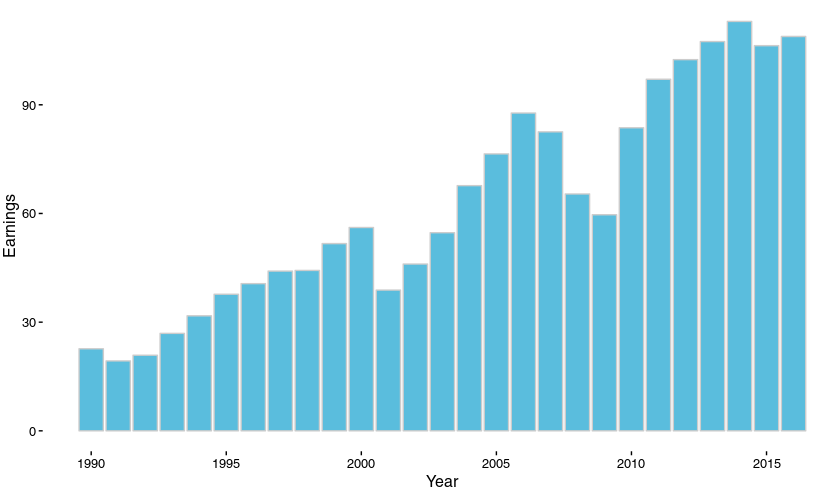
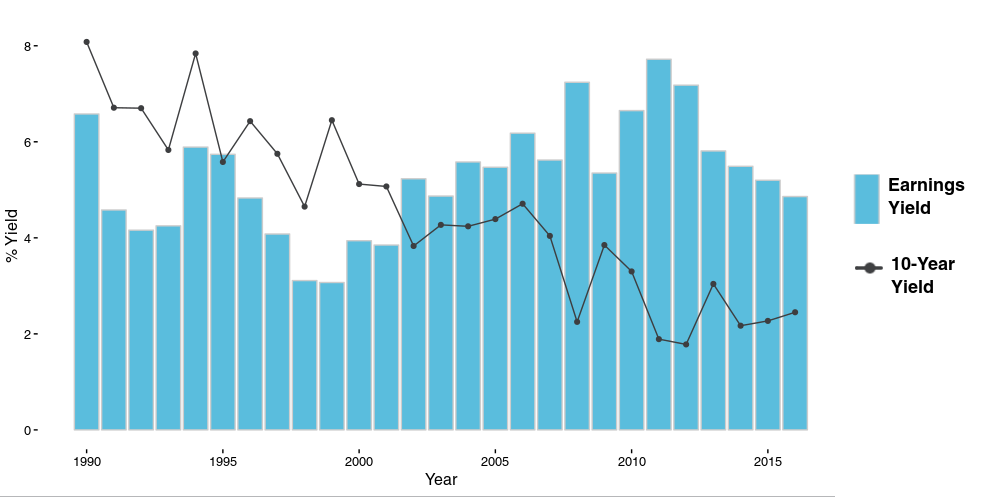
Figure 3: Earnings Yield and 10-Year Yield
This chart compares the earnings yield with the 10-year treasury yield. Source: S&P 500, Bloomberg, Aswath Damodaran
×
Are We Overvalued?
Monday 02/27/17
Recently there has been a lot of discussion of potential overvaluation by market professionals. Last week, Goldman Sachs’ chief equity strategist put out a note where he wrote that, “We are approaching the point of maximum optimism, and the S&P 500 will give back recent gains as investors embrace the reality that tax reform is likely to provide a smaller, later tailwind to corporate earnings than originally expected.” I am sympathetic to this idea, but I’m also smart enough to know that the market can ignore overvaluation for a long time and there is absolutely no reason why this would have to correct right now. However, I think it is important to look at measures of valuation for medium and long term planning. If the market is overvalued you may miss some of the best returns that can happen near the end of the business cycle, but nobody wants to get caught dancing when the music stops. This week I want to take a look at some measures of valuation that can help determine whether stocks are worth the risk versus some other asset class.Earnings
The most common way to determine market valuation is to take a look at earnings. Figure 1 shows the earnings yield of the S&P 500 on the last day of the year from 1990 through 2016 (Fourth quarter 2016 earnings include estimations since not all earnings have been reported). The earnings yield is calculated by dividing the earnings per share of a company by the market value of one share of a company, in this case we are looking at the combined earnings yields of all companies in the S&P 500. As you can see the earnings yield has been falling for the last 5 years. This doesn’t mean that earnings have fallen, in fact figure 2 shows that earnings have pretty much plateaued for the last few years. Earnings increased slightly from last year, but because stock prices increased at a faster rate, the earnings yield fell. It seems clear that stocks are more overvalued compared to the end of 2014 when earnings were higher and stock prices were lower.
Why risk it?
Instead of putting your money into stocks, it may be safer to look at government bonds. Figure 3 compares the earnings yield to the yield on a ten-year U.S. treasury bond. The long term trend on the 10-year yield has been pretty clear, but the fed already cut rates as low as they can and have started raising interest rates. The difference between the treasury yield and the yield on stocks has narrowed, but the yield from stocks is still higher, unlike in say...1999. But it doesn’t really matter what earnings were in the past or what the ten-year was previously, we want to know what they will be in the future. The following is a list of questions that need to be answered before we can get more clarity:
- What will happen with taxes and when will it happen?
- Will the fed raise interest rates more this year, and why?
- Will earnings rise/fall, and by how much?
- How much inflation will we see?
Next week we will discuss each of these topics and try to determine whether we think stocks are overvalued going forward.
Are we Overvalued? Part II
| Index | Closing Price | Last Week | YTD |
|---|---|---|---|
| SPY (S&P 500 ETF) | 236.74 | 0.52% | 6.08% |
| IWM (Russell 2000 ETF) | 138.65 | -0.52% | 3.82% |
| QQQ (Nasdaq 100 ETF) | 130.26 | 0.18% | 10.08% |
Figure 1: Earnings Yield
Figure 2: Earnings Per Share of the S&P 500
Figure 3: Earnings Yield and 10-Year Yield